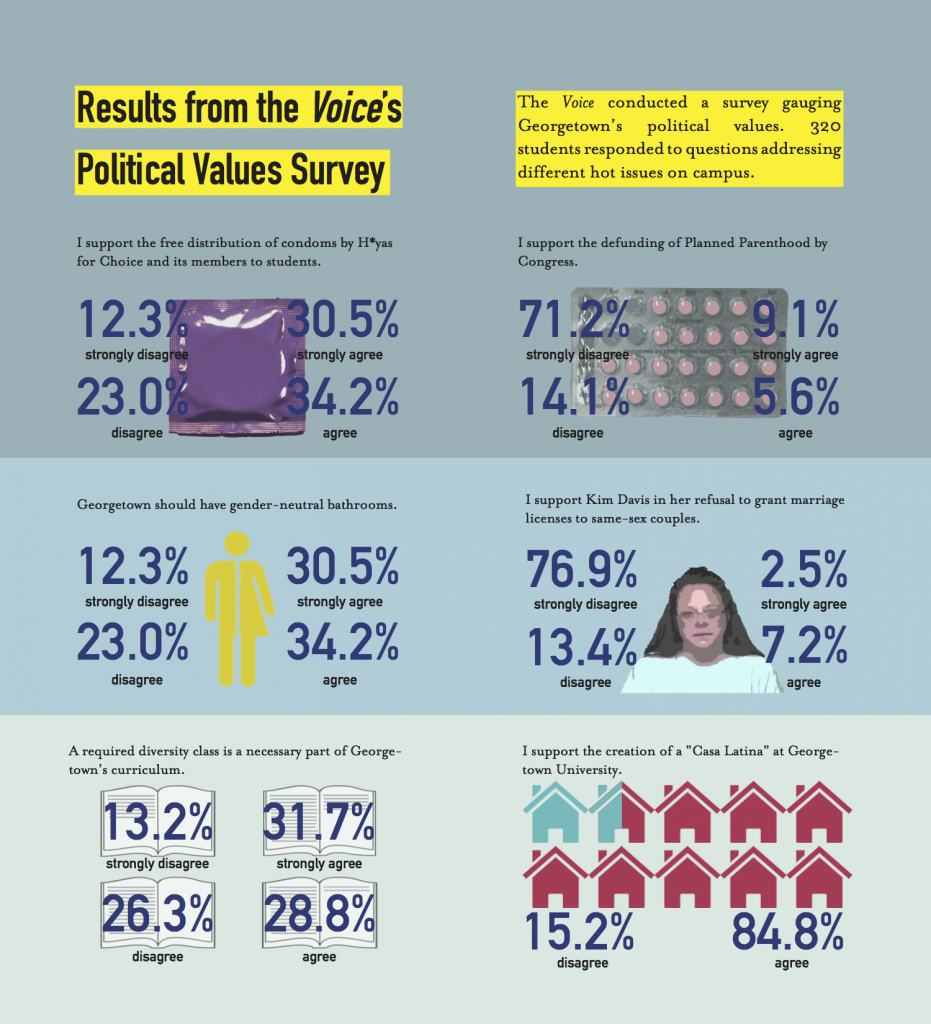
In the past month, the Voice reached out online and to a variety of student organizations in an attempt to illustrate (unscientifically) the student body’s attitudes to campus and national issues. 320 students responded to the anonymous, multiple-choice survey.
The results are as follows, shown in percentages. The numbered within the parenthesis refer to the number of respondents who selected that answer choice.
“I support the free distribution of condoms by H*yas for Choice and its members to students.”
Strongly Agree 75.9% (243) • Agree 15.3% (49) • Disagree 4.7% (15) • Strongly Disagree 4.1% (13)
“I support the defending of Planned Parenthood by Congress.”
Strongly Agree 9.1% (29) • Agree 5.6% (18) • Disagree 14.1% (45) • Strongly Disagree 71.2% (228)
“Georgetown should have gender-neutral bathrooms.”
Strongly Agree 30.5% (243) • Agree 34.2% (49) • Disagree 23.0% (15) • Strongly Disagree 12.3% (13)
“I support Kim Davis in her refusal to grant marriage licenses to same-sex couples..”
Strongly Agree 2.5% (8) • Agree 7.2% (23) • Disagree 13.4% (43) • Strongly Disagree 76.9% (246)
“A required diversity class is a necessary part of Georgetown’s curriculum.”
Strongly Agree 31.7% (101) • Agree 28.8% (92) • Disagree 26.3% (84) • Strongly Disagree 13.2% (42)
“I support the creation of a ‘Casa Latina’ at Georgetown University.”
Strongly Agree 38.9% (123) • Agree 45.9% (145) • Disagree 10.1% (32) • Strongly Disagree 5.1% (16)
Not included in the above graphic:
“I believe rape culture exists on college campuses.”
Strongly Agree 48.9% (156) • Agree 34.8% (111) • Disagree 10.7% (34) • Strongly Disagree 5.6% (18)
“I can confidently express my political views in front of my peers.”
Strongly Agree 43.8% (140) • Agree 39.7% (127) • Disagree 13.8% (44) • Strongly Disagree 2.8% (9)
“An organization should provide a “safe space” for me if I attend an event where speakers hold views that are contrary to mine.”
Strongly Agree 8.4% (27) • Agree 27.5% (88) • Disagree 34.7% (111) • Strongly Disagree 29.4% (94)
“I believe that an organization supported by Georgetown’s funds should not invite a speaker that holds views contrary to mine.”
Strongly Agree 0% (0) • Agree 0.9% (3) • Disagree 29.3% (93) • Strongly Disagree 69.7% (221)
Graphic by Pam Shu and Sophie Super
This graphic was originally published in the Oct. 23, 2015 issue.


You guys seriously need to take a statistics course or read the Provost’s blog about survey methodology.
BTW, we’ve just assigned this to one of our writers who will have a post ready on it next week.
literally no one cares
You evidently cared enough to comment. Anyways, post is scheduled for this coming Thursday, the 29th.
Can you clarify the results to the first question (regarding condom distribution)? The graphic and the followup text do not offer the same results. One shows a 30/34/23/12 breakdown, the other 75/15/4/4.