
Last semester, the Princeton Review ranked Georgetown University as the second-most politically active college. Whether it’s the proximity of the Hilltop to the Hill, or the many political figures who speak on campus, Georgetown has a reputation for a strong political culture. The Voice conducted an online reader survey to see if this reputation holds true and to try to discern what political values animate our campus.
This feature is a report of our findings. It is not intended to be a scientific representation of Georgetown’s politics or speak to the specific policy preferences of each student. Rather, the questions were designed to leave some room for ambiguity and to shed light on the underlying political ideologies of different segments of the student body. The full results of the survey are available at georgetownvoice.com.
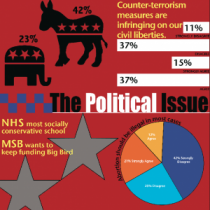
Responses indicate that Georgetown students on the whole identify more frequently with the Democratic Party than the national average. Dems are the plurality here with 42 percent, and non-affiliated, or, independents, comprise the second largest group with 29 percent. Less than a quarter of respondents consider themselves Republicans. 2 percent consider themselves Libertarian, and 2 percent described themselves as “other.” 1 percent say they belong to the Green Party. Gallup poll numbers from January 2013 indicate a third of the national population is registered Democrat, about 38 percent is Independent, and slightly more than a quarter is Republican.
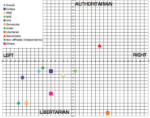
Overall the respondents tended to be liberal, especially on social issues, but there seems to be more economic progressivism on campus than the typical Georgetown moniker “fiscally conservative but socially liberal” would suggest.
For instance, a majority of respondents (around 60 percent) say they disagree or strongly disagree with the statements that regulation of business is usually harmful and that “poor people rely too much on government assistance programs.” 71 percent disagree or strongly disagree with the idea that the rich are too highly taxed.
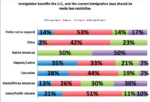
On the social side, 78 percent support increasing limits on the sales of firearms. The same percentage of respondents approve of protecting the environment at the cost of economic growth. Slightly less than three-quarters believe that not only does immigration benefit the US, but that immigration laws should also be made less restrictive.
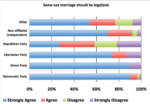
More than 80 percent agreed that same-sex marriage should be legalized and that healthcare should be more affordable and accessible. Close to 67 percent of respondents disagree or strongly disagree that abortion should be illegal in most cases.
“College students tend to lean left, so that Democrats dominate at 42 percent at Georgetown is not surprising,” said Matthew Carnes, S.J., an assistant professor in the Government Department. Referring to the Gallup poll numbers, he also said that independents outnumber Republicans nationally as well, so that result is not surprising.
“Because Georgetown tends to draw, in many cases, from a more educated and, in some cases, affluent background, I would expect that [norm] to be tempered more to the right,” he said, comparing Georgetown students to other college students.
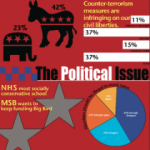
On issues of national security, however, the University is almost evenly split. 52 percent of respondents do not believe counter-terrorism measures infringe upon citizens’ civil liberties, while 48 percent believe that they do. 48 percent also disagree or strongly disagree with the statement that the U.S. military should play a significant role as a global peacekeeper, with the rest of the respondents agreeing or strongly agreeing.
Respondents are also divided on the issue of whether the primary social responsibility of a company is the interest of shareholders: 47 percent reported that they agree or strongly agree with this claim, while 53 percent disagreed.
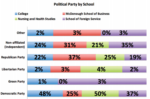
The schools vary widely in terms of their political beliefs, with the McDonough School of Business and the School of Nursing and Health Studies reporting more conservative responses than the College and the School of Foreign Service. Each school varies on which political party dominates its population. About half of the respondents from the College and NHS are Democrats, while more of the MSB respondents identify as Republicans than any other party. While Democrats are the majority in the SFS, the school has the highest percentage of independents, at about 35 percent.
MSB respondents agree with conservative views on fiscal issues, but lean toward more liberal stances on social concerns. About 62 percent of these respondents say government regulation of business is usually harmful, compared to the University-wide rate of 32 percent. Almost 39 percent of MSB respondents also believe the rich are too highly taxed, while the overall rate is 29 percent.
“MSB students are more tuned in to the ramifications of the fiscal crisis, recession, and crippling debt, and recognize the need for realistic solutions to the problems our economy continues to face,” said Mallory Carr (COL ‘15), Vice Chair of the College Republicans.
MSB responses match the overall rates more closely in regards to social concerns, though they are still slightly more conservative. Almost 72 percent, compared with 78 percent overall, agree or strongly agree the government should protect the environment, even if it has negative effects on the economy. About 72 percent of MSB respondents also favor the government making healthcare more affordable and accessible, compared with a school-wide rate of 81 percent. The school, however, overwhelmingly supports the use of the death penalty, with over 70 percent of respondents saying it should be an option for “the most heinous of crimes.”
The NHS were, for the most part, more conservative than MSB students on fiscal issues. 71 percent say that they agree or strongly agree that disadvantaged rely too much on government assistance, compared with about 63 percent of MSB respondents.
The NHS responses also tend to agree with conservative views on social issues more so than other schools. The school has the lowest rate of respondents supporting the legalization of same-sex marriage at about 71 percent—13 points lower than the University-wide rate. About 19 percent fewer NHS respondents supported the legalization of marijuana than the rest of the schools; the others average almost 69 percent of respondents supporting legalization.
The only exceptions to this trend are in their responses on abortion and the sale of firearms. About 62 percent of NHS respondents say they disagree or strongly disagree that abortion should be illegal in most cases. This response closely matched the school-wide rate, which is about 67 percent. Almost 80 percent also say that they believe the government should increase limits on the sales of firearms, a rate just 0.4 percent below that of the College.
The College respondents, on the other hand, agree mostly with liberal stances, though they are divided on national security issues, similar to the overall trend. Students in the College disapprove of the idea that regulation of business is usually harmful, with over 61 percent disagreeing. Over 65 percent say they do not believe the disadvantaged rely too much on government assistance, and over 62 percent disagree with the idea that the interest of shareholders is the primary social responsibility of a company.
The College and the SFS have similar rates of disagreement with the statement “the rich in the U.S. are too highly taxed;” both are just above 70 percent for students who disagree and strongly disagree.
On many social issues, the College supports liberal stances at a higher rate than any other school. Respondents support the legalization of same-sex marriage at almost 91 percent, close to 8 percentage points above the SFS and 20 above the NHS. The College also supports protecting the environment, even if it worsens the economy, at more than 81 percent. This is almost 4 percentage points above the SFS and about 10 above both the MSB and NHS. The College is about 6 percentage points lower than the SFS in supporting the idea that immigration should be less restrictive.
The SFS responses almost mirror those of the College. The biggest discrepancy between the two comes with the statement that the interest of shareholders is the primary social responsibility of companies—14 percent fewer in the SFS disagree with the statement than their College counterparts.
The same occurred with social issues, where the two schools did not vary more than 10 percentage points. About 60 percent of SFS respondents believe counter-terrorism measures infringe upon civil liberties, compared to about half of the College.
Georgetown students do not follow national trends when it comes to voting. 11 percent of respondents say they do not vote, while the national estimate shows more than half of young voters—ages 18 through 29—did not vote in the national election, according to a study by the Center for Information & Research on Civic Learning and Engagement.
The NHS has the highest turnout rate; over 95 percent vote (though their respondent pool is much smaller than the rest and may therefore be less accurate). The MSB has the lowest voter turnout, with about 18 percent of respondents saying they do not vote. The respondents from the College and the SFS vote most often, over 40 percent in each school reporting they vote in every national, mid-term, and local election.
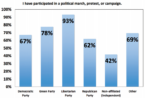
Students do not only vote to involve themselves in politics; exactly 60 percent of respondents report having participated in a political march, campaign, or protest.
College Democrats President Trevor Tezel (SFS ‘15) described his experience with the Obama campaign in 2012. “Especially as we got closer to the election it was pretty inspiring to see so many students out there every weekend,” he said, “even in the midst of midterms and schoolwork.”
SFS students have the highest rate of participation in such activities, at almost 70 percent. The College is slightly below that at 60 percent. Both the NHS and MSB have less than half of respondents participating in such activities, with about 42 and 36 percent, respectively.
The independent respondents, who make up about 29 percent of the student body, are the least politically active. Over 21 percent of them say they do not vote; this rate is surpassed only by 7 of the 13 students who identify their political party as “other.” Independents also have the lowest rate of respondents who say they have been involved in a political march, campaign, or protest. Almost 42 percent say they have not been involved with any of those activities.
“I guess I am a little bit surprised it’s not higher,” Carnes said about the rate of student participation in political activities. “But having said that, in other environments I’ve been in, I’m willing to guess it’s lower there. To have more than half the student body participate in some way in elections and in campaigns, that’s pretty impressive.”

Can you make the Data available o the public? If it already is can you please post a link.