Halftime Sports Editor Matt Jasko examines the intersection between finance, economics, and athletics in his segment, “The Cap.”
After last night’s NLDS series conclusions, SportsCenter released a fascinating graphic on its social media pages. It had three pictures: the first depicting the elation of the NLCS-bound New York Mets, the second depicting the elation of the NLCS-bound Chicago Cubs, and the third depicting the deflation of the golf course-bound Los Angeles Dodgers. The caption read: “Money doesn’t buy happiness… Los Angeles Dodgers payroll: $314 million… Chicago Cubs + New York Mets payroll: $254 million.”
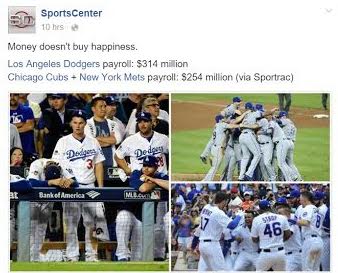
It is mind-boggling to consider that the total combined payroll of the two teams in the NLCS trumps that of one who did not reach it. Furthermore, what the graphic doesn’t mention is the fact that the sum of the two payrolls represented in the ALCS—those of the Kansas City Royals and Toronto Blue Jays—represent a sum of $264 million, likewise a far cry from the Dodgers’ $314 million.
This serious discrepancy begs a question: what elements allowed the Mets, Cubs, Royals, and Blue Jays to reach championship series while spending significantly less than not only the Dodgers, but also a host of other teams. Even the highest-spending team in the league championship round, the Jays, spent less than nine MLB teams this year.
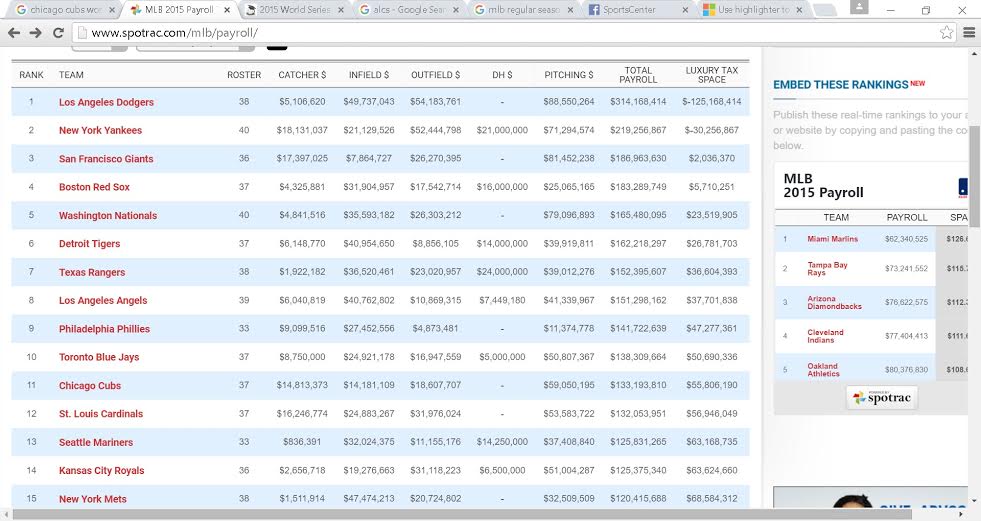
Sportrac
To answer this question, the first logical place to turn is the chart above, which not only indicates total payroll, but also indicates position breakdown relative to comparable payrolls in the league. Beginning with the American League teams because the similarities are most evident through comparing the designated hitter position, we find that both ALCS teams spend comparably little on their DHs. The Jays at $5 million and Royals at $6.5 million are the lowest and second-lowest respectively among AL teams ranking in the top 15 MLB payrolls.
This is the second consecutive year in which ALCS teams have demonstrated a serious departure from previous ALCS budget allocations. In the range from 2011-2013 the teams that played in the ALCS spent an average of $24.325 million on the DH position. Over the same period the average ALCS team payroll was $153.29 million, making the DH position responsible for approximately 15.86 % of the total budget.
However, in 2014 the ALCS pairing of the Baltimore Orioles and Kansas City Royals spent $18.3 million of their $208.62 million on the DH slot, representing a 28.12% drop-off to 11.40%. Again, this season there was a drop-off an additional 72.5% from last year’s mark to a miniscule 4.36%, represented by the Royals’ and Blue Jays’ spending of $11.5 million on the DH out of their total $263.66 payroll.
Of course, this sample size is extremely small (it is difficult to track back further with great precision because sportrac’s MLB records only go to 2011), and as such the massive percent changes cannot be taken at face value; however, with that being said, the trend represented here is nonetheless thought-provoking. After all, the DH only plays in American League home games, and at that is only involved in a relatively tiny fraction of the total number of plays on the field. Though a power bat in the center of the lineup can be lethal, it does raise questions about how much production in this highly-specific category is actually worth.
We are able to compare relative values of players at the same position through WAR (wins above replacement) because we can plug in a replacement-level player at that position and compare relative production. However, to go across positions, we have to look at WARs relative to each other, relative to overall salary; in short, we have to determine the wins we would give up by signing a replacement-level player rather than a current DH, and then look at the absolute value of the difference between that total and the total number of additional wins we could accumulate by spending that money to improve other positions.
This analysis is difficult because the free agent market is largely dictated by what specific players are available within a year, how many players at each position are available, what the overall league demand for that position is, and the willingness of the respective free agents to play for a price relative to market value. This also does not take into consideration the fact that WAR year to year is as difficult to predict as any statistics, especially with veterans (because their production can drop significantly at any moment) who comprise the majority of the free agent pool due to the MLB’s CBA.
What we can say, however, is that the ALCS teams in recent years have found a way to do this successfully. The areas and degrees to which they spend the money are varied (as you would expect because their needs at particular positions are equally varied), but the common American League denominator is that the successful teams have not skimped on pitching.
The Blue Jays have spent more on pitchers on a NOMINAL basis than five out of the nine teams ahead of them in overall payroll, and though 13 teams have had the luxury of being able to spend more than the Royals, they have still outspent seven of them on pitching on a NOMINAL basis as well. Forget overall budget constraints, these teams refuse to allow their valuable pitching to be hampered by money. Likewise, we find every team to have played in the last five ALCSs except the 2011 Texas Rangers to be in the top half of nominal pitching expending (the Rangers were only one slot away), and seven of the ten teams were in the top 10 of nominal spending, regardless of overall budget.
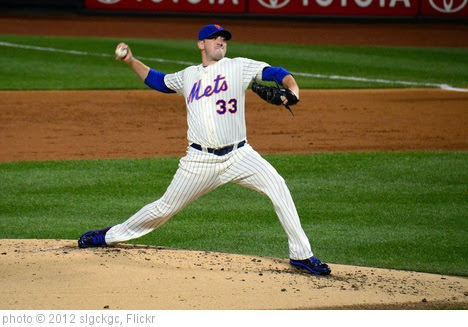
However, as we begin to turn our attention to the National League, one number jumps out at us—a mere $32.5 million spent on New York Mets’ pitching. This number, however, speaks less to the Mets being unwilling to spend on pitching and more to their good fortune in low-salary pitchers panning out. Take for example the Met’s expected starting pitching for this series—Jacob deGrom, Noah Syndergaard, and Matt Harvey. For a combination of reasons including injury and age, the Mets were able to make low-monetary risks on these players, to a tune of a $526K average salary. No, not a typo. $526K average salary for the top three starters of a NLCS team.
Of course, this analysis only looks at the ultimate upside the Mets reaped. It could have just as easily turned out that Harvey reinjured himself, deGrom never developed, and Syndergaard wasn’t ready for the Bigs. But the only thing that matters now is that those things didn’t happen; the Mets made a bet on those guys, and they won on it.
Much of the same could be said of the Cubs. Take for example their rookie phenom, Kris Bryant. For $471K this year, the Cubs got an All-Star, Home Run Derby participant who drove in 99 RBIs, knocked 26 home runs, legged out five triples, and had an on-base percentage of .369. Not many places you can get that production for that value.
So, the lessons here for clubs looking to keep their payroll modest while contending for a World Series bid are two-fold. Firstly, for American League teams, great care should be taken in evaluating the value of a designated hitter. If budget space allows and there are not feasible options to improve other positions on the market, the money might as well be spent on the DH. However, as the trend exemplified by recent ALCS teams demonstrates, in many cases the money spent on a player who has a relatively modest effect on a limited number of games may often be better spent somewhere else, particularly if pitching can be improved.
Secondly, costs can be kept low for teams in either division by placing bets on rookies and/ or players with chronic injury problems. Often times teams avoid this strategy out of fear of downside. However, as examples particularly evident on the Mets and Cubs demonstrate, the upside can be dramatic, and if downside can be capped reasonably (as the Mets did in their rotation and the Cubs did with their star rookie), then the upside far outweighs the downside. This is extremely limited empirical analysis, but it does lend itself to the proposition of at least carrying out more analysis to see how often, to what extent, and under what circumstances teams should take risks on players of highly variable potential productivity when they can keep the financial side of the equation in check.