In the early to mid-20th century, baseball was unquestionably America’s pastime. Today, we still revere stars like Babe Ruth and Jackie Robinson, who were cultural icons as well as excellent baseball players. However, baseball itself has been upstaged by professional football and basketball as the sport of choice for many Americans today. This is due to the perception that baseball isn’t as exciting or action-packed as other notable professional sports. Though Major League Baseball (MLB) has higher overall attendance figures than the National Football League (NFL) or National Basketball Association (NBA), this is primarily due to the fact that baseball has twice as many regular season games as basketball, and over 10 times as many regular season games as football. According to Ryan Glasspiegel’s analysis, NBA regular season games on ABC average about 3.6 million viewers while MLB games on FOX are around 2.2 million. Dino-Ray Ramos wrote that on October 27, 2019, a regular-season Sunday Night Football game drew 16.19 million viewers, compared with 10.22 million viewers for Game 5 of the 2019 World Series between the Washington Nationals and the Houston Astros.
In theory more runs would generate more excitement in baseball, so Major League Baseball (MLB) used a new type of baseball beginning with the 2019 season: the “juiced ball”. This ball is tighter at the seams, meaning that when hit, it travels further in the air. Hitting the ball in the air generally produces better offensive outcomes, such as doubles (2B), triples (3B), and home runs (HR). The 2019 MLB season saw the most home runs ever hit in a single season of all of baseball, with 6,776 across the league, which was 890 home runs more than the previous season. MLB teams tend to prioritize players that have the potential to hit a high amount of home runs like Joey Gallo of the Texas Rangers or Bryce Harper of the Philadelphia Phillies, even if it also results in more strikeouts. This is because home runs are generally the best way to ensure that a maximum number of runs score.
On the other hand, a high run-scoring environment does not bode well for pitchers. The most widely recognized statistic used to describe pitchers is the earned run average (ERA), which is the number of earned runs a pitcher allows every nine innings. Though ERA is fundamentally flawed in that the definition of “earned” can be somewhat ambiguous, it is still commonly used to quickly characterize pitcher performance. Pitchers with lower ERAs are considered better, whereas pitchers with higher ERAs allow more runs and are considered worse. Thus, with a higher run-scoring environment, one would expect pitcher ERA to increase as well.
As previously mentioned, ERA is by no means a perfect descriptor of a pitcher. If a defensive player is out of position or lets a ball drop in the outfield, and that runner eventually comes around to score, it is still counted against a pitcher’s ERA. Of course, there are other predictive statistics that help to measure the value of a pitcher. One such predictor is strikeout percentage minus walk percentage (K% – BB%), which is calculated as the number of strikeouts (K) subtracted by the number of walks, or bases on balls (BB), and then divided by the total batters faced (TBF). MLB teams value pitchers that strike batters out instead of allowing contact to ensure that runners in the field of play don’t get a chance to advance on the basepaths. Teams also prefer pitchers that don’t allow too many walks, since these are “free passes” that can eventually come around to score. Another predictor to consider is average fastball velocity (vFB), in miles per hour. Pitchers that have a higher vFB are able to throw the ball by the hitters, which in theory would lead to a higher number of strikeouts. However, juiced balls that are hit at higher incoming velocities will also travel farther, which may lead to inflated ERA figures, especially in relief pitchers with smaller sample sizes.
From a statistical standpoint, then, what impact does the juiced ball have on ERA for qualified pitchers? One type of test is the ANOVA test, where I compared pitchers that threw over 150.0 innings using the juiced ball to those that did not use the juiced ball. Among pitchers that pitched over the inning threshold in both 2018 AND 2019, there is no statistically significant difference in mean ERA between pitchers that used the juiced ball over a season and pitchers that did not (F = 0.894 with 1, 82 df; p-value = 0.347 > 0.10 = α).
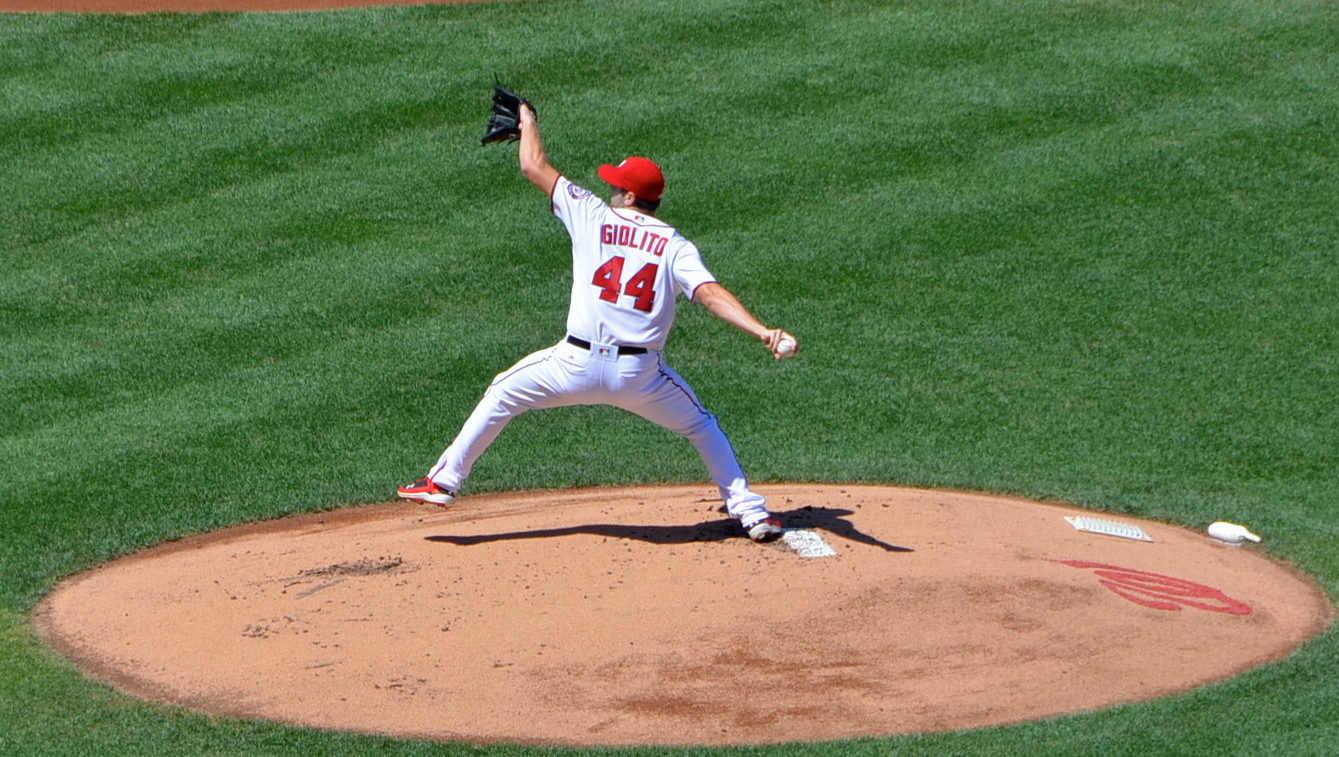
This result may be because some pitchers experienced drastic improvement from 2018 to 2019 due to simple growth as a player, with Lucas Giolito of the Chicago White Sox being the best example. In 2018, he struggled with allowing too many walks and not enough strikeouts, mustering a 4.5% K% – BB% en route to a 6.13 ERA. The next season, Giolito dramatically increased his strikeouts and cut his walks, striking out around 4 times the number of batters he walked while actually slightly decreasing his HR/9 (“Lucas Giolito – Stats – Pitching”, 2020). These factors combined led him to post a career-best 3.41 ERA, even with the juiced ball. Giolito improved aspects of his game that were unaffected by the new ball design and turned in his best year as a result. Other pitchers like Jake Odorizzi of the Minnesota Twins and Luis Castillo of the Cincinnati Reds made similar changes, leading to career years for them as well.
Another way to analyze the juiced ball’s impact is a regression that also considers K% – BB% and vFB. The multiple regression equation is Y = 0 + 1X1i + 2X2i + 3X3i = 3.7704 – 0.0866X1i + 0.0150X2i + 0.1811X3i, where Y is the estimated ERA for a given K% – BB% X1i, a given vFB X2i, and a given juiced ball factor X3i, which is given a value of 1 if the pitcher used the juiced ball and 0 if the pitcher did not. Again, I considered only the pitchers that threw over 150.0 innings. In this model, for pitchers among a particular vFB and K% – BB%, those that used the juiced ball had, on average, an ERA 0.1811 units higher than those that did not use the juiced ball. Furthermore, this result is statistically significant at the 90% significance level (T = 1.723 with 149 df, p-value = 0.0869 < 0.10 = α).
As expected in the multiple regression model, K% – BB% had a significant association with ERA at the 90% significance level. After all, that is why MLB teams covet players that “command” the strike zone, meaning they do not concede too many walks. The idea of command is also a primary reason why vFB does not have a significant association with ERA. If a pitcher understands where the strike zone is, they can throw slower pitches at the corners of the zone to just barely be called a strike. Control pitchers like Kyle Hendricks of the Chicago Cubs (vFB 86.9 mph and 3.44 ERA in 2019) and Hyun-Jin Ryu of the Los Angeles Dodgers (vFB 90.6 mph and 2.32 ERA in 2019) show that pitchers can succeed without throwing hard.
[aesop_image img=”https://georgetownvoice.com/wp-content/uploads/2020/06/399px-Josh_Hader_on_March_25_2019_cropped.jpg” panorama=”off” imgwidth=”600px” credit=”Photo by: D. Benjamin Miller” align=”right” lightbox=”on” captionsrc=”custom” captionposition=”left” revealfx=”off” overlay_revealfx=”off”]
However, after controlling for fastball velocity and K% – BB%, the juiced ball does appear to have a significant impact on pitcher ERA. It’s less pronounced for starting pitchers with high volume, but it’s particularly evident in two elite relief pitchers. The first of which was Josh Hader of the Milwaukee Brewers. Hader was used primarily in the 8th inning of games in 2018 and posted a ridiculous K% – BB% of 36.9% that season en route to an ERA of 2.43 over 81⅓ IP. The average velocity on his fastball increased from 95.2 mph to 95.9 mph in 2019, but Hader suffered a worse year. In 2019, Hader was used to seal victories by closing games out in the 9th inning when the Brewers had a narrow lead. Though Hader’s K% – BB% increased to 40.8%, his HR/9 increased dramatically from 1.00 to 1.78. Hader had seven blown saves in the regular season and another one in a single elimination playoff game, meaning that he had relinquished the lead eight times in the season. Hader was virtually unhittable, but whenever batters were able to hit his pitches in 2019, they hit them hard, and the juiced ball may have led to the rise in HR/9 for Hader.
The second relief pitcher was Edwin Diaz, who played for the Seattle Mariners in 2018 and the New York Mets in 2019. Diaz has always been known for throwing hard, averaging 97.9 mph in 2018 and 97.8 mph in 2019 on his fastball. He was used in the 9th inning in the closer role in both years, and his 2018 season is one of the finest on record for a closer: 1.96 ERA, 38.2 K% – BB%, and 57 saves. The Mariners turned to him with a slim lead 61 times, and 57 of those times Diaz preserved the lead for a victory. However, his 2019 season was a complete turnaround in the wrong direction: 5.59 ERA and seven blown saves, the same number as Hader. Diaz gave up 2.33 HR/9 in 2019, a drastic increase from his 0.61 HR/9 in 2018 . The juiced ball affected Diaz heavily, because his velocity was still elite, and he still recorded a very good K% – BB% of 30.3%.
Hader and Diaz are the reasons why I included the minimum innings for qualified pitchers restriction. They both had elite velocity and struck batters out at high rates, but over a small number of innings, they got tagged for home runs and their ERAs inflated (especially Diaz). However, if there were some better way to measure a reliever’s performance change due to the juiced ball, future studies could consider that. The same could be said of starting pitchers that threw less than the minimum innings to qualify for this study. A statistic that would somehow smooth out volatility from throwing a low number of innings would prove highly beneficial in evaluation of relief pitchers as well as in this study.
Perhaps most importantly, it would be helpful to directly conduct experiments on how the juiced ball affects distance travelled by the ball. If a juiced ball is launched from a machine at an optimal angle with a high exit velocity, how does that affect the distance it travels compared to a “non-juiced” ball? Ultimately, this kind of very controlled experiment would be best in assessing the impact of the juiced ball.
Yet, these mechanics cannot be controlled for during MLB games. Top-flight starting pitchers have to deal with many different factors that can influence their ERA and performance statistics, ranging from simple factors like facing better hitters to more complex factors such as the impact of playing at their home ballpark. Across pitchers that have similar strikeout and walk rates, though, the juiced ball does have a significant impact on ERA, lending some credence to the theory that the ball allows for more home runs and pitchers are set up to fail. The fact that this phenomenon occurs over a large sample size in innings shows that it is a reality that all pitchers face, not just relievers who throw less innings. It will be interesting to see how pitchers adjust to the juiced ball by emphasizing strikeouts and ground balls even more, and if the MLB will continue to use the juiced ball in the future.
For the full study, click here.
All statistics courtesy of Fangraphs.


